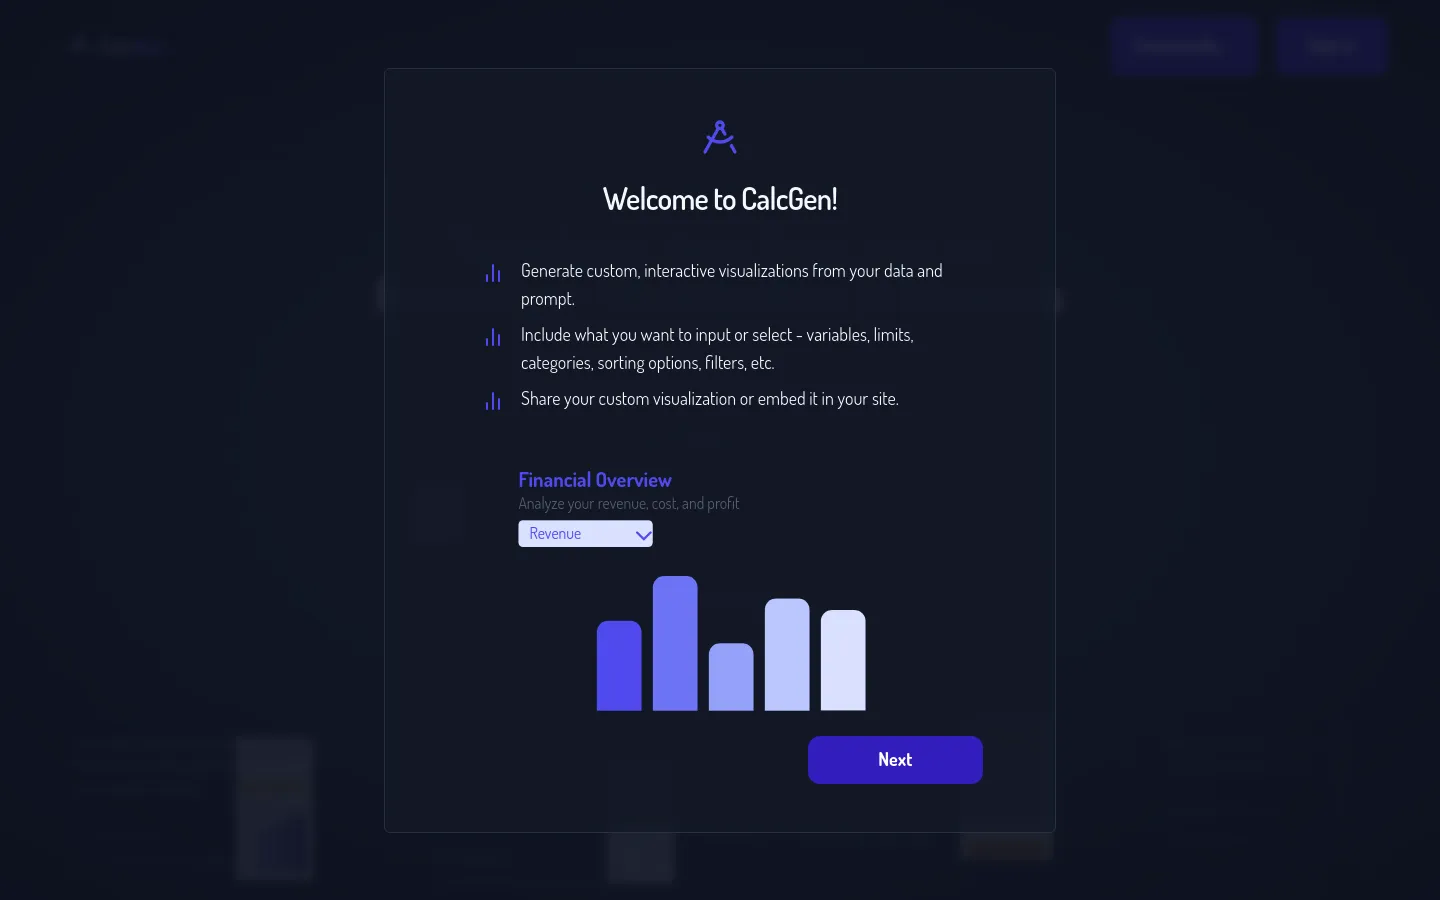
Create stunning, interactive data visualizations in seconds! Simply describe your chart, and CalcGen AI does the rest. Use your own data or let our agent research it for you. Make data analysis fun and engaging.

CalcGen AI is a powerful tool that lets you create custom, interactive visualizations from your data, without needing any technical skills. Easily specify variables, limits, categories, sorting options, filters, etc. to build dynamic interactive visualizations. Easily share your visualizations with others or embed them on your site.
CalcGen AI can be used by anyone who wants to create interactive visualizations for their data, including data analysts, marketing managers, educators, and software developers.