
Visualize stocks from major markets on Bubble Screener in an engaging bubble chart. Identify trends or gain insights into the stock market landscape.
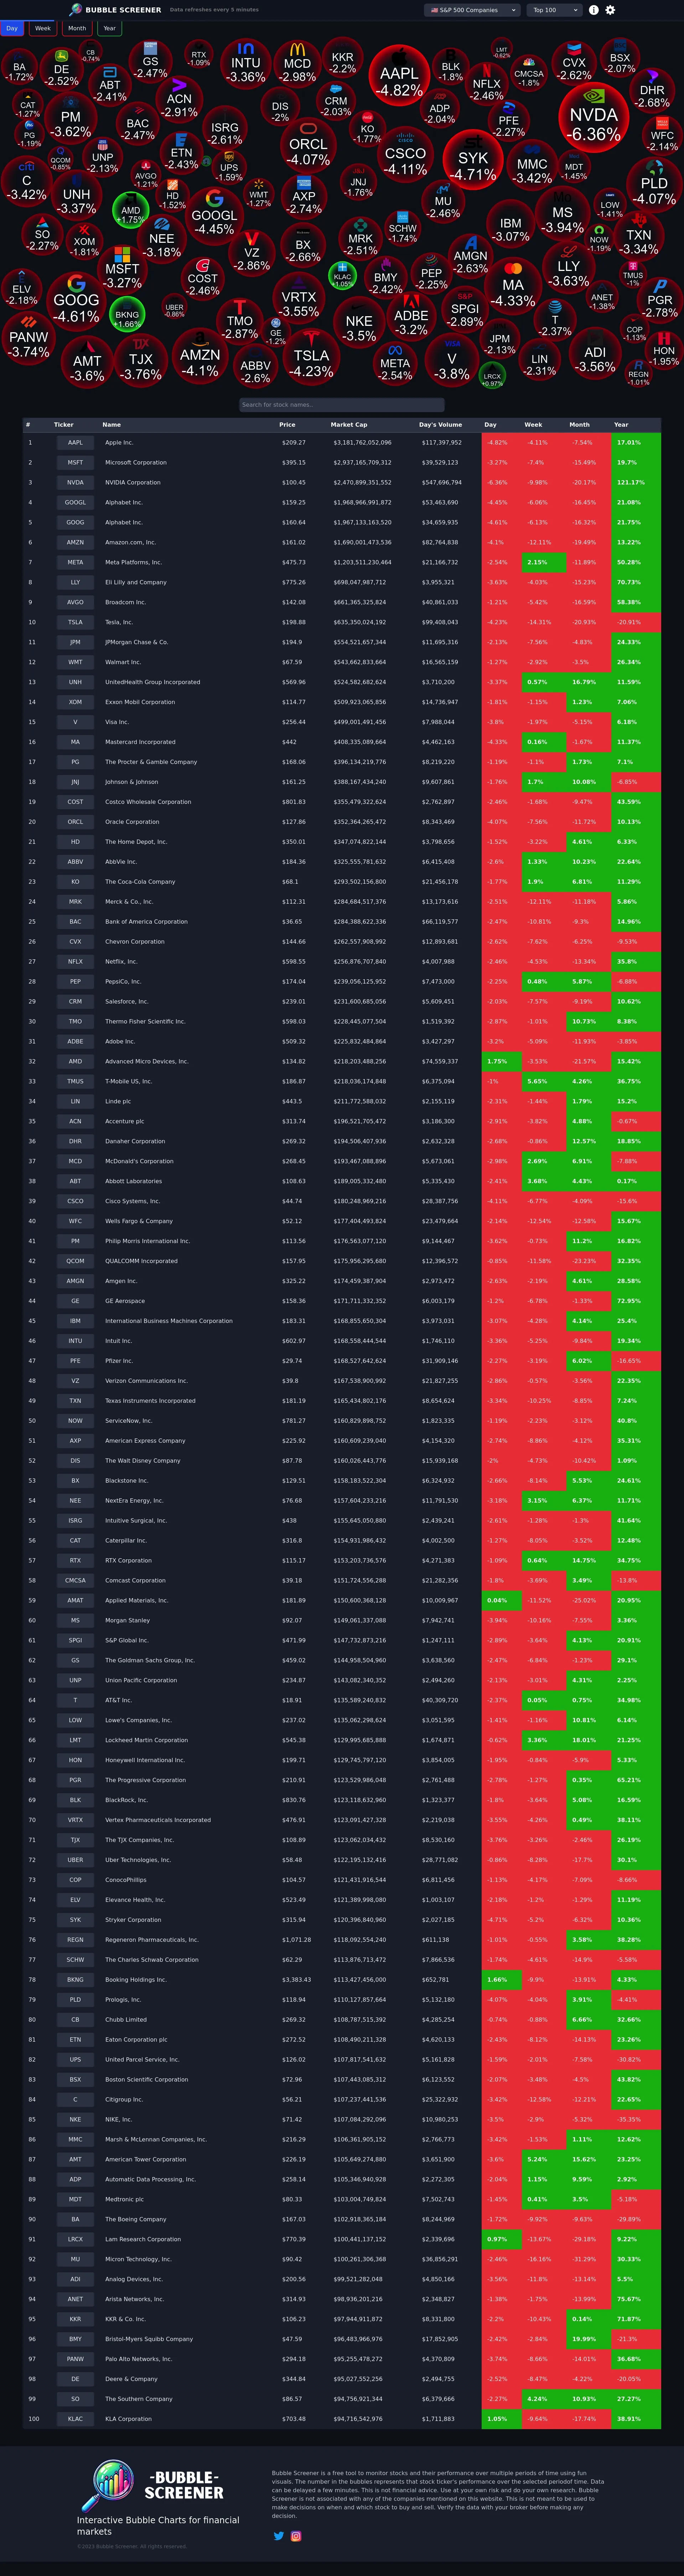
Bubble Screener is a free tool for monitoring stock performance.
Bubble Screener is developed by a dedicated team focused on providing interactive and user-friendly financial market tools. The team is committed to continuous improvement and expanding the range of covered indices.
AI-powered financial research assistant for data-driven decisions
Research stocks and ETFs in seconds.

Match with like-minded professionals for 1:1 conversations

Go from Slack Chaos to Clarity in Minutes

Personalize 1000s of landing pages in under 30 mins

The first LLM for document parsing with accuracy and speed

AI Assistants for SaaS professionals

AI-powered phone call app with live translation

Delightful AI-powered interactive demos—now loginless

AI Motion Graphics Copilot

Pop confetti to get rid of stress & anxiety, 100% AI-free

Smooth payments for SaaS