Categories
Technical Visualization Related Products
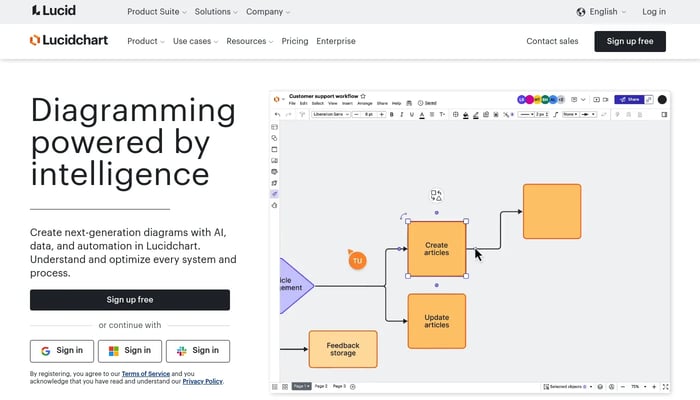
Lucidchart
Visualize Your Ideas, Streamline Your Workflows
AI-Powered Diagram Generation
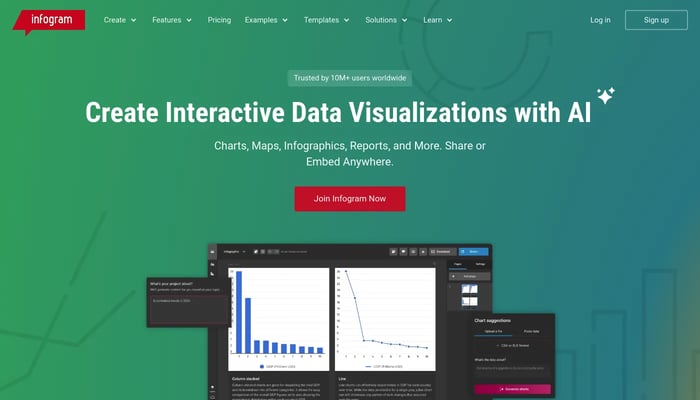

Infogram
Turn data into engaging stories with AI-powered visualizations.
Interactive Charts
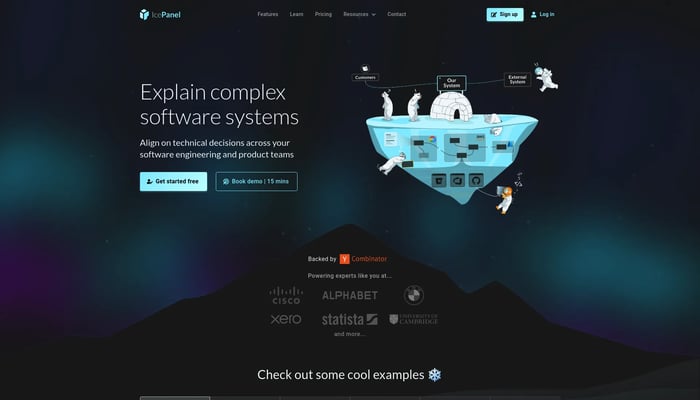

IcePanel
Explain complex software systems to engineering and product teams
Software Architecture Diagramming


Chartio
Chartio is changing how companies work by building the best…
Data Visualization


Dashboards As Code
Build dashboards with ease of canvas & power of code
Dashboards as Code
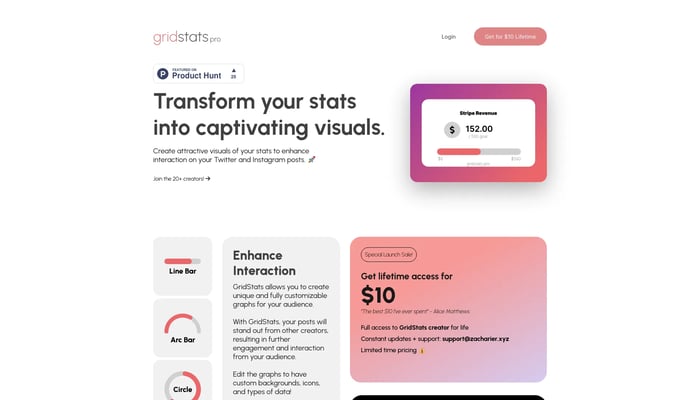

GridStats.Pro
Create stunning visuals for your stats
Interactive Charts

Okay
Dashboards and actionable insights for high-performing engineering…
Engineering Performance

ChartFast
AI data analyst: Automate visualization, analyze instantly.
AI-Powered Data Analysis


Graphy AI
Turn your data into impactful stories with AI.
Data Visualization
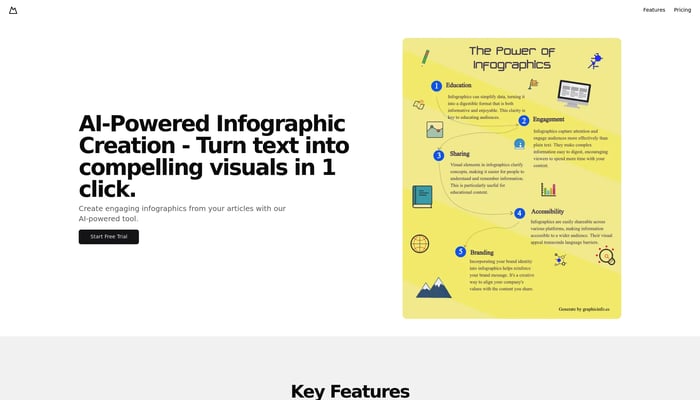
GraphicInfo
Turn text into compelling visuals with one click.
Text to Infographic
Columns
Collaborative data visualization platform.
AI-Powered Data Visualization

Lychee
AI-Powered Data Visualization in 0.32 seconds.
Spreadsheet to Graph
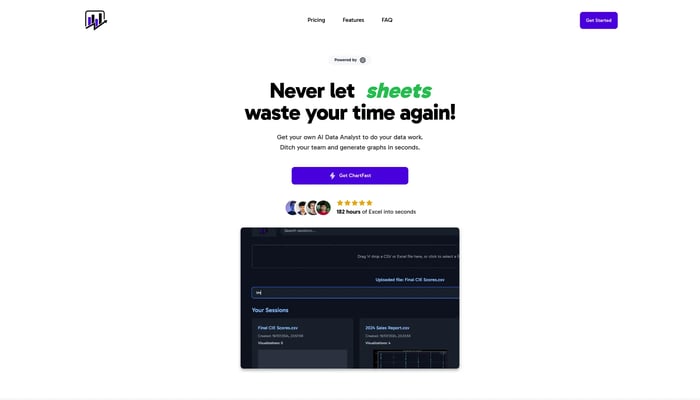

ChartFast
Get your own AI data analyst to do your data work
AI Data Visualization
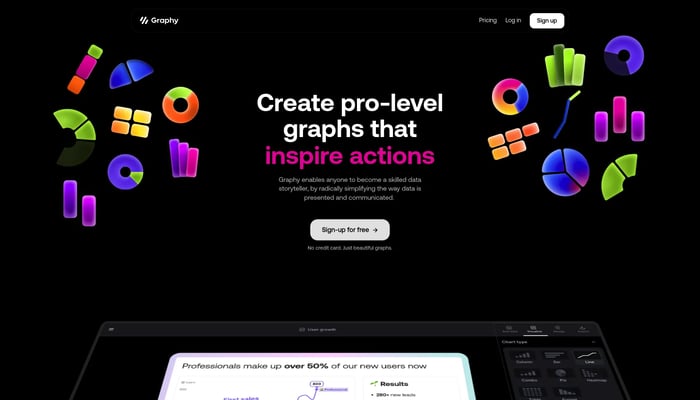

Graphy for Data Storytelling
Create pro-level graphs that drive actions.
Data Storytelling
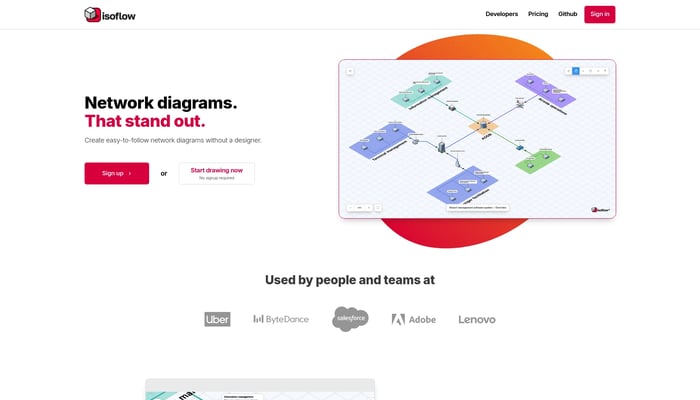
Isoflow
Create beautiful cloud diagrams
Cloud Infrastructure Visualization


MyLens.ai
AI that answers anything with insightful visuals.
Text to Image
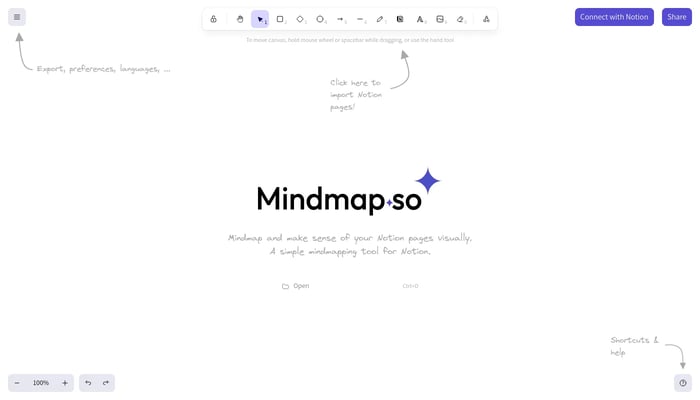

Mindmap.so
Visualize your Notion pages, understand relationships, and unlock clarity.
Notion Integration


CalcGen AI
Interactive Data Visualizations. One Prompt.
AI-Powered Charting
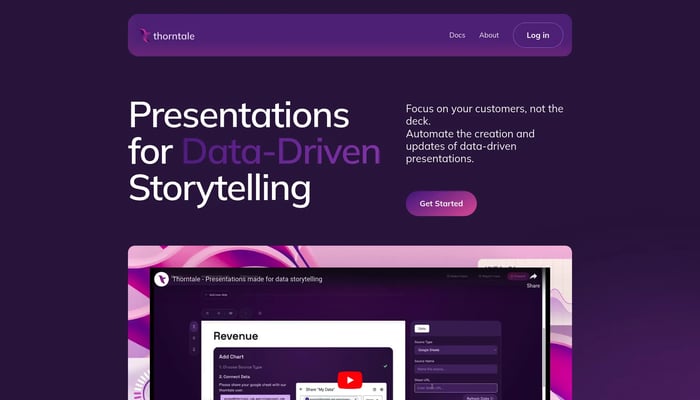

thorntale
Canva for data, product, and engineering teams
Data Visualization

Whimsical
Visualize, brainstorm, and collaborate to bring product ideas to life.
Collaborative Workspace
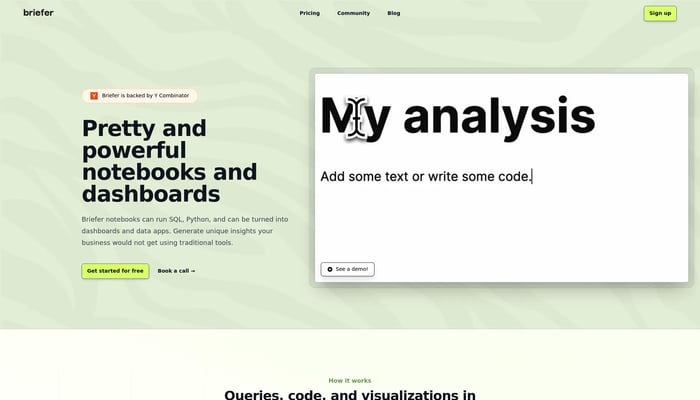

Briefer
The collaborative data platform.
Data Science
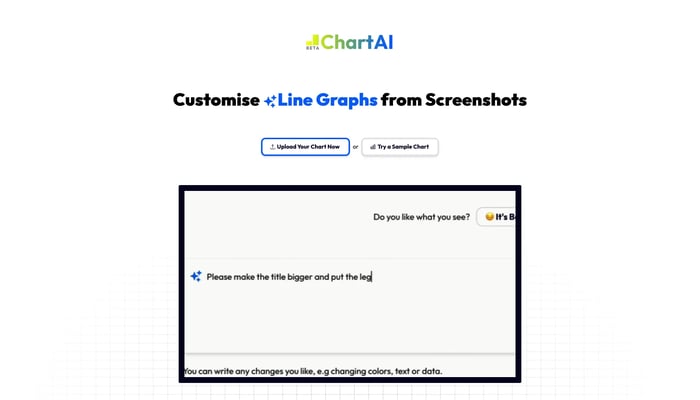
ChartAI
Customise charts from screenshots instantly.
Chart Editing
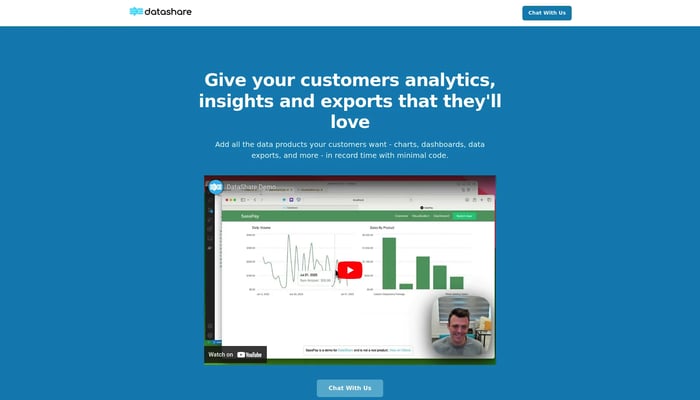

DataShare
Embed charts, dashboards and exports in your app
Embed Charts and Dashboards
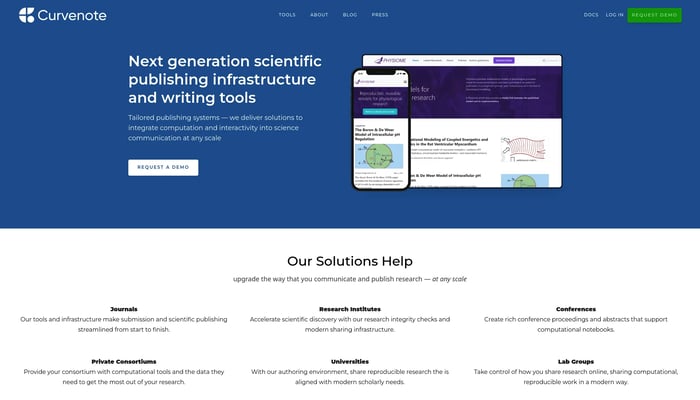

Curvenote
Communication and publishing tools for scientists
Interactive Reports
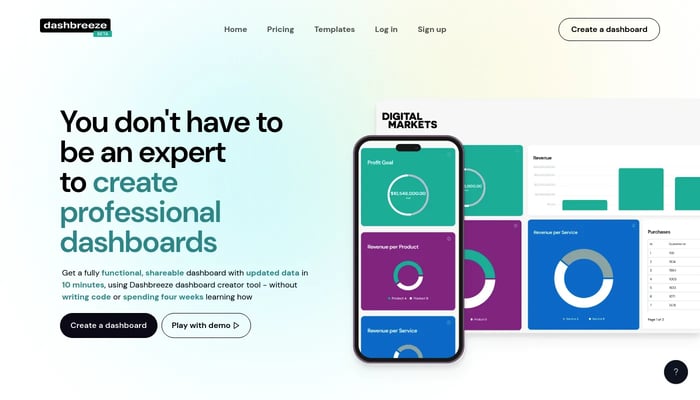

Dashbreeze
Create professional dashboards in minutes, without coding.
Real-Time Dashboards
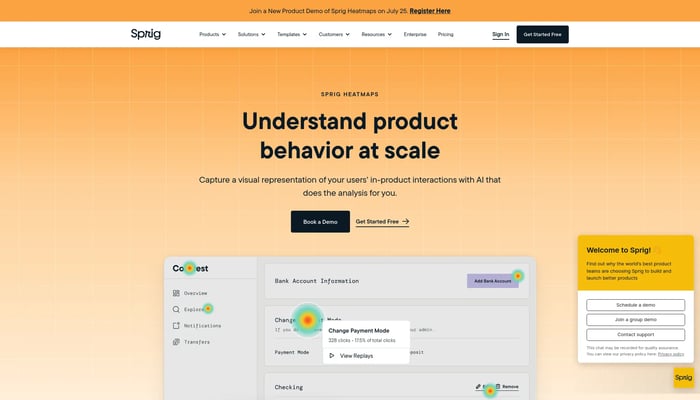

Sprig Heatmaps
Capture and analyze your product behavior at scale with AI
Heatmaps


CodeViz
Interactive codebase schematics
Codebase Mapping
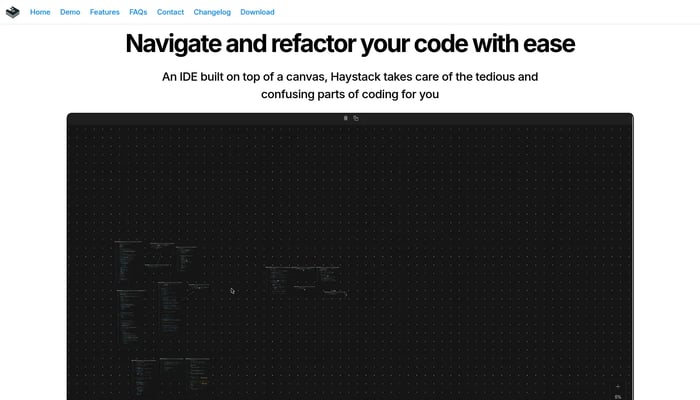

Haystack
Visualize and edit your codebase on an infinite canvas
Visual Code Editing
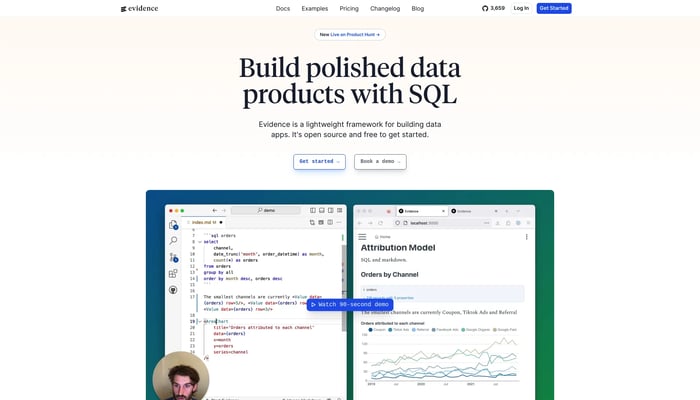

Evidence
Fast, interactive, client-ready dashboards
SQL-Based Dashboards

ExcelDashboard AI
Transform Excel files into instant dashboards.
Excel Dashboard AI

